When you search "grow startup," you get a tactics dump: thirty channels, ten hacks, a dozen frameworks. So you try a few. Some weeks feel busy and productive; others feel flat. But ask yourself the honest question on a Friday afternoon — did we actually grow this week, and because of what? — and most tiny teams can't answer it. The numbers live in three dashboards and a founder's head, the metrics that move are buried under signups and page views, and the loudest tab wins your attention. That gap isn't a channel problem. It's a visibility problem. Before you can grow a startup deliberately, you need a lean growth scoreboard: a handful of stage-appropriate metrics, a recurring ritual to review them, and one place the numbers and their context live. This is a buyer's guide to building that scoreboard — what to measure, what to ignore, the Friday review that holds it together, and where it should run.
The real 'grow startup' bottleneck for a tiny team isn't channels — it's visibility
Most founders don't fail to grow because they picked the wrong channel. They fail because effort scatters: a little content, a little outreach, a half-built referral idea, an onboarding tweak — none of it measured against the same scoreboard, so nothing accumulates into a clear signal. When you can't see whether growth is working, every shiny tactic looks equally plausible, and you end up busy instead of compounding.
Reframe the keyword for a second. "Grow a startup" is usually treated as a tactics question — which lever, which channel, which sequence? For a tiny team, the prior question matters more: what do we measure, and how do we review it? You can pull the right lever and still not know it worked, because the number that would have told you was never on the board. Visibility is upstream of every tactic.
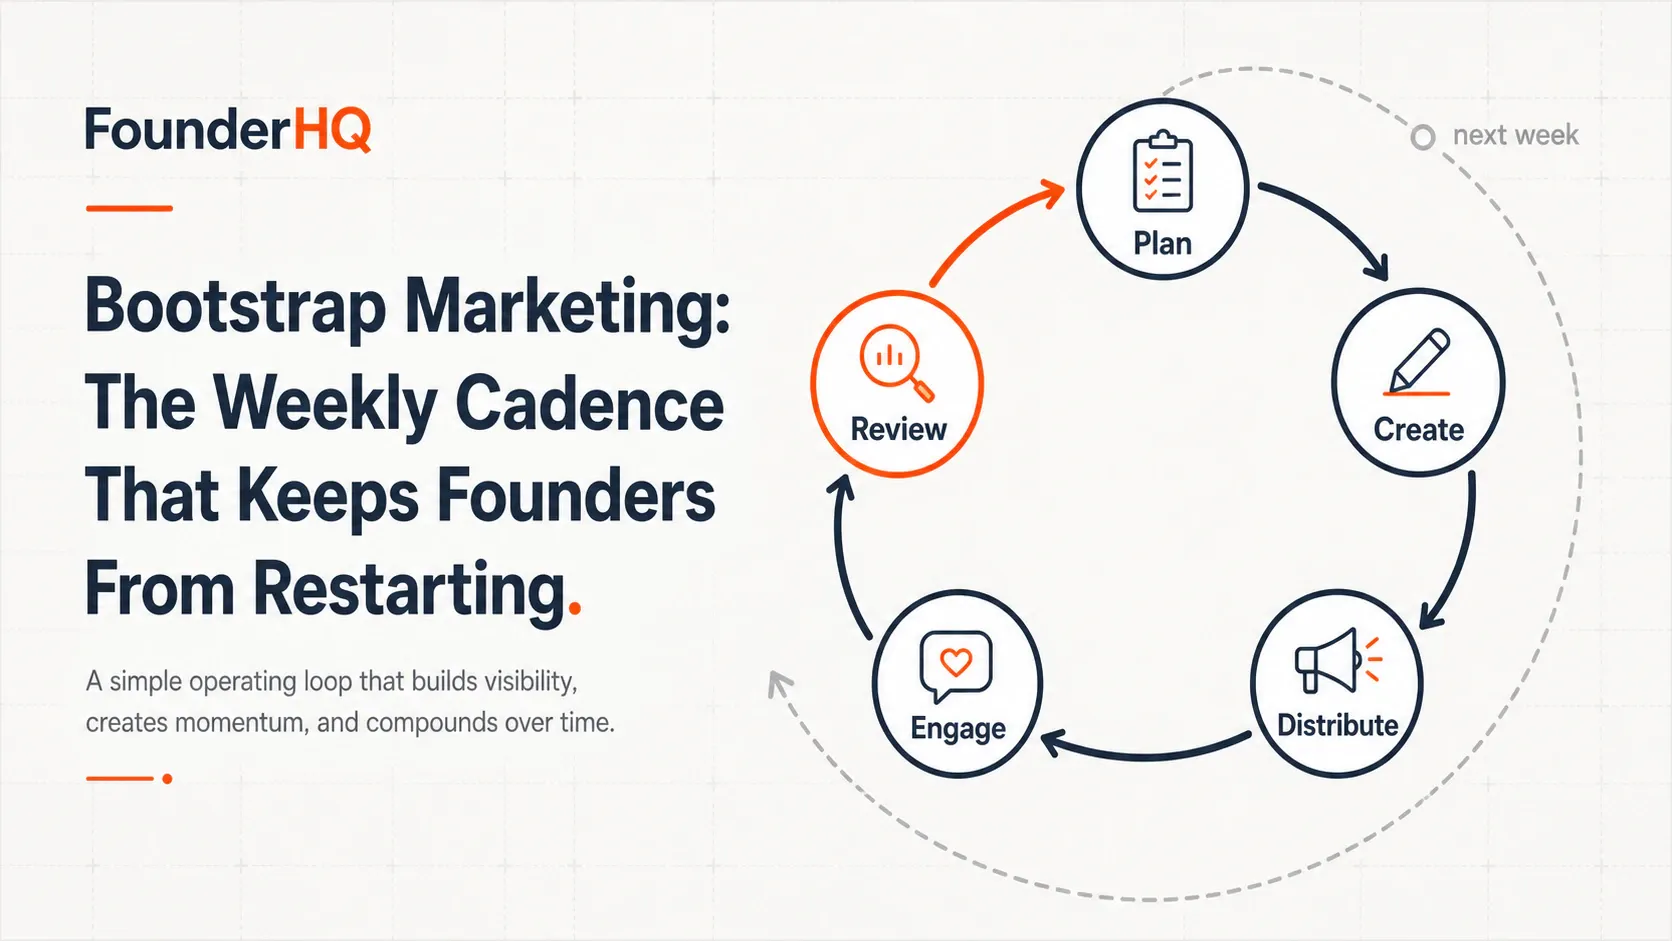
The thesis of this guide is simple. Pick a small scoreboard of the metrics that matter for your stage. Review it on a fixed cadence — we'll anchor it to a standing Friday review with a real agenda and a decision log. Keep the numbers and the why behind them in one place. Then act. That's it. The rest of this article walks the three decisions that make it real: which metrics, what the Friday ritual looks like, and where the scoreboard lives — with three honest ways to run it and a clear rule for choosing.
One scope note, because growing a startup gets sliced a lot of ways: this guide is about the measurement and scoreboard layer. It is not about which channel to pick, how to sequence acquisition and retention work, or which single growth lever deserves your hours. Those are real decisions — but they're all downstream of being able to see what's happening. Get the scoreboard right first, and every other choice gets easier.
What actually moves growth: the few metrics that matter by stage
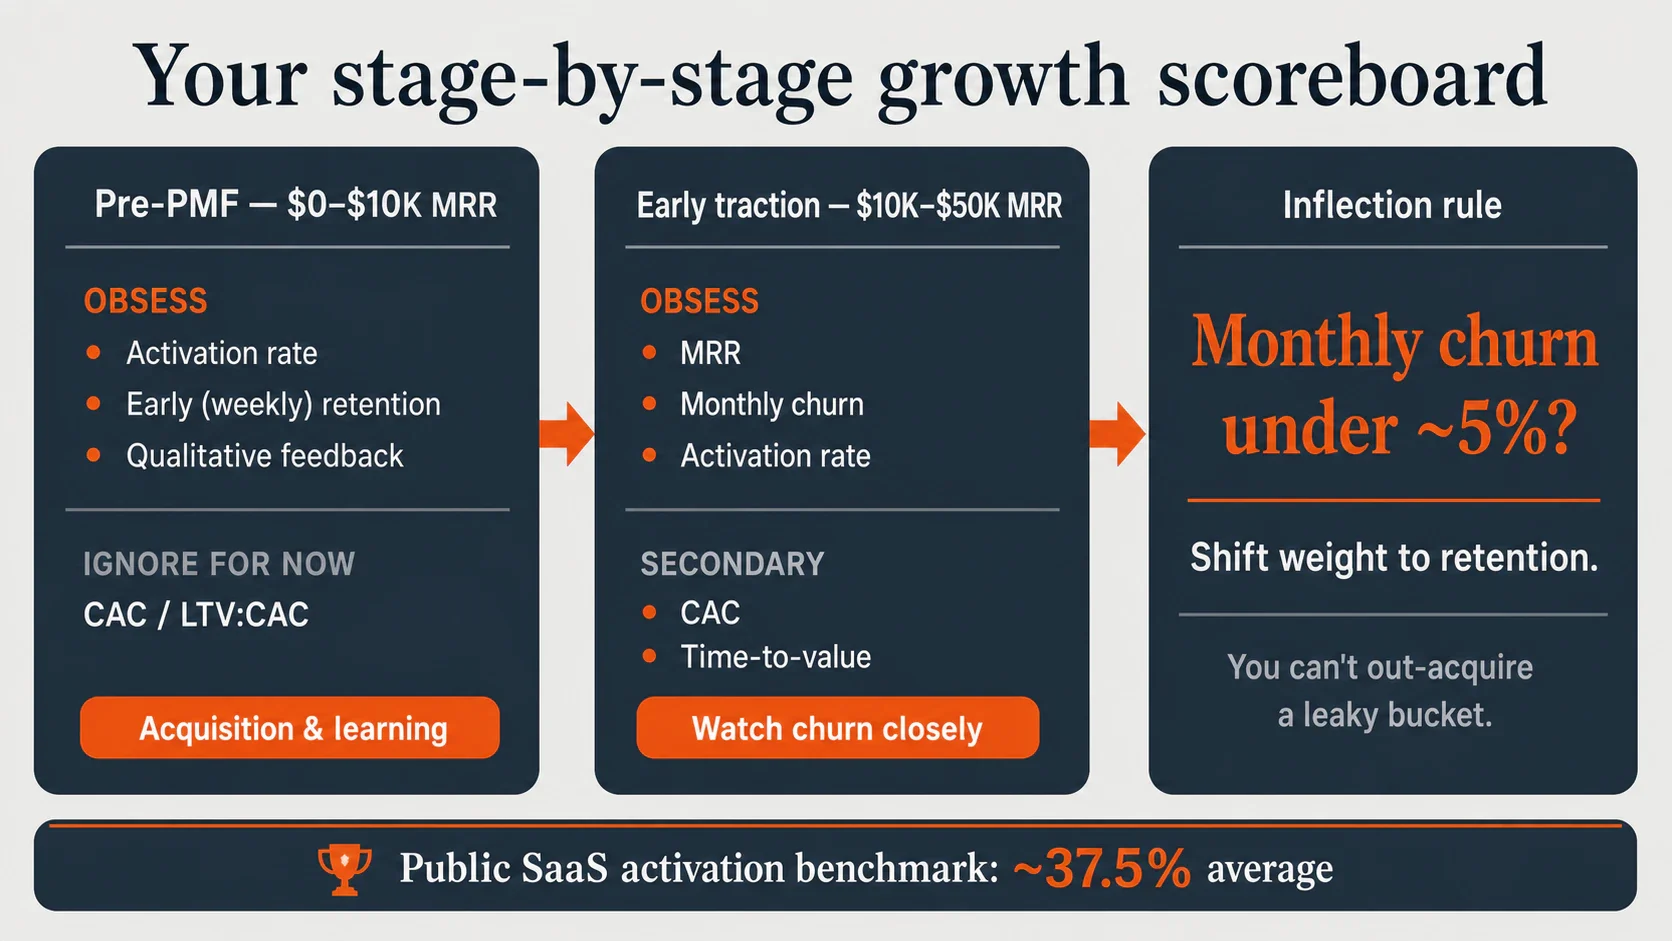
The fastest way to make a scoreboard useless is to track everything. A tiny team can hold two or three numbers in genuine focus; beyond that, you're maintaining a dashboard instead of running a company. So the design rule is subtraction: choose the metrics that lead growth at your stage, and consciously ignore the rest until your stage changes. The infographic below maps the obsess-list, the ignore-list, and the lead metric to each early stage.
Pre-PMF ($0–$10K MRR): activation and early retention
Before product-market fit, revenue is too small and too noisy to steer by. The metrics that actually predict growth are activation rate — the share of new users who reach first real value — and early (weekly) retention, the share who come back. Pair them with one qualitative signal: what your first users actually say and do. Customer acquisition cost and LTV:CAC are mostly theater at this stage; your sample is too small for the math to mean anything, so leave them off the board for now.
The benchmarks say why activation deserves the spotlight. Public SaaS activation benchmarks cluster in the mid-to-high 30% range: Userpilot's research across 62 B2B companies reports a roughly 37.5% average activation rate (with a median around 37%), and Tandem cites 36–37.5% as a useful general baseline with a median closer to 30%. These are third-party benchmarks, not a universal target — but the takeaway isn't the decimal point. It's that for a typical product, well over half of new users never reach the activation event. For most teams, activation, not traffic, is the real growth bottleneck hiding in plain sight.
Early traction ($10K–$50K MRR): add MRR, churn, and time-to-value
Once money is coming in with some consistency, the board grows slightly. Lead with MRR, monthly churn, and activation rate; treat CAC and time-to-value (TTV) as secondary, watch-this metrics. Time-to-value earns a seat because shorter time-to-value is consistently treated as a leading signal of stronger retention before revenue reflects it (SaaS Mag). The pattern operators report is directional but reliable: customers who reach first value quickly are far more likely to stick, while those who don't reach a first-value milestone inside the first 30 days drift toward churn even when they're technically still onboarding (Lyniro).
This is the trap founders fall into: they watch lagging numbers (revenue, total users) and miss the leading ones (activation, TTV, early retention) that would have warned them weeks earlier. Amplitude's blunt heuristic is useful here — products that deliver value in the first week see materially better long-term outcomes, and about 69% of products with strong early activation were also strong three-month retention performers (Digital Applied, Amplitude). Early retention is the earliest honest read on durable retention you can get.
Here is the same map as a quick reference. Each block lists the two or three metrics to obsess over, anything to watch as secondary, what to ignore for now, and the lead metric that frames the stage.
Pre-PMF ($0–$10K MRR)
- Obsess (2–3): activation rate; early (weekly) retention; qualitative feedback
- Watch / secondary: none yet — keep the board tiny
- Ignore for now: CAC; LTV:CAC
- Lead metric: acquisition & learning
Early traction ($10K–$50K MRR)
- Obsess (2–3): MRR; monthly churn; activation rate
- Watch / secondary: CAC; time-to-value
- Ignore for now: vanity totals (signups, page views)
- Lead metric: watch churn closely
Stage | Obsess (2–3) | Watch / secondary | Ignore for now | Lead metric |
|---|---|---|---|---|
Pre-PMF ($0–$10K MRR) | Activation rate; early (weekly) retention; qualitative feedback | — | CAC; LTV:CAC | Acquisition & learning |
Early traction ($10K–$50K MRR) | MRR; monthly churn; activation rate | CAC; time-to-value | Vanity totals (signups, page views) | Watch churn closely |
The practical takeaway: pick two or three metrics for your stage, write them at the top of the board, and treat the ones you cut as deliberately ignored — not forgotten, just not in focus this quarter. A measure you stare at every Friday changes behavior; a measure buried in a tab does nothing.
Retention vs. acquisition: which number your scoreboard should lead with
Even a small board needs a lead metric — the one number that, if it moves the wrong way, overrides everything else. Whether that's an acquisition number or a retention number depends on your stage and your churn, and the 2026 economics make the choice sharper than it used to be.
The stage rule for your lead metric
Pre-PMF, early churn is signal, not failure — you're still learning who your real users are, and losing a few is part of the search. Acquisition and learning lead the board. The widely cited inflection point is monthly churn: once it's consistently under about 5%, shift weight toward retention (Monolit). For early-stage startups, acquisition comes first simply because you can't retain customers you don't yet have; post-PMF, retention becomes the indicator you watch most closely, because above ~5% monthly churn no acquisition strategy outruns the leaky bucket.
A clean "choose this if" framing comes from Twig's teardown: fix CAC/acquisition first if you're early-stage (under ~$5M ARR) or CAC payback is over 18 months; fix churn first if you're growth-stage or monthly churn is over 3% (Twig). For calibration, healthy monthly logo churn benchmarks in 2026 run under 1% (exceptional), 1–2% (strong), under 3% (acceptable), and over 5% (a serious retention problem) (beancount.io). Pre-PMF products commonly sit higher — published 2026 ranges put seed-stage SaaS monthly churn around 5–10% (RetentionCheck) — but the more useful signal there isn't the absolute number, it's whether churn is trending down cohort by cohort.
Why you can't out-acquire a leaky bucket in 2026
The reason this matters more now is unit economics. CAC payback has stretched — 12–18 months is the 2026 median for B2B SaaS, with anything past 24 months flagged as a sustainability concern (beancount.io). When acquiring a customer costs roughly 5–7x more than keeping one, pouring spend into the top of a leaky funnel is the most expensive mistake a small team can make (Monolit).
The scoreboard implication is structural: your lead metric changes as you cross stages, so your tracking setup has to be easy to re-point. A rigid, hand-built dashboard frozen around "signups this week" becomes a liability the moment churn becomes the number that matters. Design for the metric to move, not for the dashboard to stay.
The buyer's decision: three ways to run your growth scoreboard
Knowing what to measure leaves the practical question: where does the scoreboard actually live? There are three honest options for a tiny team, and none is universally best. The right one depends on your stage, your appetite for setup, and how much the context behind the numbers matters to you. The infographic above lays out the metric side of this; here's the where-it-runs side.
Option A — Spreadsheet + founder memory
A spreadsheet plus what's in your head is the cheapest and most flexible option, and for a pre-PMF solo founder it's often correct. You can add a column in seconds and reshape the whole thing on a whim. The cost is fragility: the why behind each number lives in your memory, the figures go stale the moment you stop hand-updating them, and the system quietly breaks the day a second person needs to understand it.
- Setup effort: low
- Cost: roughly free
- Best fit: pre-PMF, reviewing solo
- Preserves context? weak — it lives in your head
- Choose this if you're pre-PMF, reviewing solo, and optimizing for speed over durability.
Option B — Stitched point-tool analytics stack
Wire up a product analytics tool, a dashboard layer, and a docs app, and you get genuine power: real cohort retention, proper funnels, automated charts. The trade-off is setup, ongoing cost, and tool sprawl — and a subtler problem: the data lives in one tool while the narrative (decisions, why a number moved, what you'll do about it) lives in another. Reviews turn into tab-switching, and instrumentation becomes a part-time job.
- Setup effort: high
- Cost: adds up across tools
- Best fit: early traction, willing to maintain it
- Preserves context? split across tools
- Choose this if you have the time and skills to instrument it properly and keep it maintained.
Option C — Consolidated, context-aware operating system
The third option keeps the scoreboard and the context around it — the decisions, the messaging, the product journeys behind each number — in one place, so a review can move straight to action instead of reconstruction. You trade some of the spreadsheet's raw flexibility and the stack's deep analytics for speed-to-decision and a single source of truth.
- Setup effort: medium
- Cost: one system
- Best fit: tool-fatigued tiny team
- Preserves context? strong — numbers and context together
- Choose this if you're tool-fatigued, reviewing as a 2–3 person team, and you want the weekly review to actually produce decisions rather than a status update.
Side by side, the trade-offs look like this:
Option | Setup effort | Cost | Best fit | Preserves context? |
|---|---|---|---|---|
A. Spreadsheet + memory | Low | ~Free | Pre-PMF, solo | Weak — lives in your head |
B. Stitched point-tool stack | High | Adds up | Early traction, willing to maintain | Split across tools |
C. Consolidated operating system | Medium | One system | Tool-fatigued tiny team | Strong — numbers + context together |
Be honest about the trade-offs and resist the urge to over-tool. A spreadsheet you actually update every Friday beats an elaborate stack you abandon by week three. The best scoreboard is the lightest one your team will genuinely run.
The Friday growth review a 2–3 person team can actually hold
A scoreboard only grows a startup if you look at it on a rhythm. The cadence that holds for tiny teams is a 30–60 minute Friday review — your standing growth scoreboard slot — plus a monthly zoom-out on trend. The weekly cadence keeps decisions fresh; the monthly view asks the question a single week can't answer: is activation or churn actually improving over time? Point-in-time benchmarks are far less useful here than your own cohort trend — a churn number means little until you can see whether it's getting better or worse.
A five-line Friday agenda
Keep the review ruthlessly small and the same every week so it survives busy build weeks. A workable Friday agenda is exactly five lines:
- Scoreboard: read this week's value for your 2–3 obsess metrics out loud, next to last week's.
- Owner: name who owns each metric, so a number that moved has someone accountable for explaining why.
- Signal: bring one qualitative signal — a real customer quote, a support thread, a piece of feedback — that gives the numbers texture.
- Decision: force exactly one decision the scoreboard points to this week.
- Next-week experiment: write the single experiment you'll run before next Friday, and what result would change your mind.
The qualitative signal is what stops a scoreboard from becoming a vanity ritual, and forcing exactly one decision per review is what turns measurement into momentum. The metric owner matters even on a two-person team — "we'll look into it" is how a slipping number survives three Fridays untouched.
Keep a one-line decision log
Capture the why, not just the value. Your earliest users steer what your product becomes — what they push you toward is path-dependent, which is why a first build should be what one YC partner calls a minimum evolvable product, something simple that survives contact with real users and adapts fast. A scoreboard that records "activation 32%" and nothing else loses that steering information. Keep a running decision log instead — one line per Friday in the format date — metric moved — decision — owner — experiment. An activation row might read: "Jun 20 — activation 32% — the three users who stuck all came through the same onboarding path, so we'll make that the default — Ayush — ship default path by Thu." A churn or time-to-value row in the same format keeps the same discipline: "Jun 27 — early churn up to 9% — most cancels never reached first value in week one, so we'll move the core action ahead of account setup — Ayush — re-order onboarding by Wed." That single line is what makes next Friday a follow-up instead of a fresh start.
Two anti-patterns to name out loud. The first is obsessively tracking signups and page views with zero cohort-retention visibility — feeling busy while the only numbers that predict growth go unwatched. The second is running five weak experiments at once instead of one real loop; with a tiny team, five half-experiments produce no clean signal and no learning, while one focused experiment, reviewed every Friday, compounds. The cadence exists to enforce that focus.
Where FounderHQ fits: keeping the scoreboard and its context in one place
Here's where most scoreboards quietly fail: not at the math, but at the context. The numbers end up in one tool, the decisions behind them scattered across docs and DMs, and the real reasoning stuck in a founder's head. When the why is hard to find, the Friday review degrades into staring at charts, and growth slows to whatever a single person can hold in working memory.
FounderHQ is built around that consolidation problem — a unified growth stack for early-stage product teams that brings the builder, the writer, and the workspace into one focused operating system. The builder is for the product journeys, onboarding, and activation flows your scoreboard's activation and time-to-value numbers are actually measuring. The writer is for founder-led content and the market narratives that feed acquisition. And the workspace keeps your persistent company context and memory — the decisions, the reasoning, the customer signals, the decision log itself — so what you measure connects directly to what you decide and ship.
The honest framing is augmentation, not autopilot. FounderHQ doesn't run your company or hold the review for you; it's the consolidating place where the scoreboard and the context behind it live together, so the founder's judgment has better raw material to work with. That's a deliberate contrast to the "autonomous AI that runs your company while you sleep" pitch — the Friday review still belongs to you, and that's the point. The system's job is to make sure that when you sit down on Friday, the numbers and the reasons are in the same room.
For a tool-fatigued team weighing the three options above, this is what Option C looks like in practice: not another dashboard to maintain, but one place where the measurement and the meaning don't drift apart.
Recommended Videos
The pre-PMF stage of your scoreboard is really about your first users — who they are, what they push you toward, and why activation and early retention matter more than revenue. This short YC talk pairs well with that part of the Friday review: it explains why those early numbers, and the reasons behind them, are worth capturing in your decision log.
Conclusion
Growing a startup as a tiny team is, first, a measurement decision. Pick the two or three metrics that matter for your stage — activation and early retention pre-PMF, then MRR, churn, and time-to-value as you hit traction — and consciously ignore the rest. Let your stage set the lead metric: acquisition and learning until monthly churn is reliably under about 5%, then weight retention, because in 2026's economics you can't out-acquire a leaky bucket. Then make it a ritual: a 30–60 minute Friday review with a five-line agenda — scoreboard, owner, signal, one decision, next-week experiment — and a one-line decision log so each Friday builds on the last. Quick self-diagnosis: pre-PMF and reviewing solo? A spreadsheet is probably right (Option A). Early traction with the time to instrument and maintain it? A stitched analytics stack can work (Option B). Tool-fatigued and want the review to produce decisions, not status updates? A consolidated, context-aware system is the move (Option C). You don't need a perfect dashboard to start. You need a board with three numbers on it and a recurring Friday slot. Block this Friday's review, write down the one decision it forces, and let the scoreboard — not the noise — tell you whether you're growing.
Recommended Videos
A YC partner explains why early users are a search problem and why your first build should be a "minimum evolvable product" — useful context for the pre-PMF stage of the scoreboard, where activation, early retention, and the reasons behind each number matter more than revenue.