You've been posting. The MRR screenshots go out on Friday, the shipping updates land midweek, and the likes trickle in. Months go by. And the quiet question that nags at every time-poor founder is the one almost no build-in-public guide answers honestly: is this actually working, or am I just posting? The trap is that the numbers your platforms put in front of you — likes, follower count, total impressions — are the easiest to watch and the least informative. They feel like progress because they grow, but they rarely tell you what to change or whether anything is moving toward customers. This article is not another playbook on what to share, how often, or how to convert reach into pipeline — we've covered those elsewhere. It's the missing measurement layer: a small scoreboard of leading signals you can pull in a few minutes each week, plus an honest read on how long the payoff really takes, so you can judge your effort on evidence instead of vibes.
Why likes and followers mislead you
Here's a clean test for any metric, borrowed from a 2026 analysis by Monolit: if a number moves and you don't immediately know what to test, fix, or double down on, it's a vanity metric; if it moves and you know your next move, it's actionable. Total likes and raw follower count almost always fail that test. They can climb for months without a single buyer getting closer to your product — and they can sit flat for months while the signals that actually matter are climbing underneath them. Watching the wrong number leads founders to quit something that's working, or keep grinding on something that isn't.
The deeper problem is who your audience is, not just how big it is. Multiple 2026 practitioner sources make the same point: a small audience of buyers beats a large audience of peers by a wide margin. As the ReplySocial 2026 build-in-public playbook puts it, followers are vanity and conversion-per-follower is the metric that pays — and the way you build a buyer-skewed audience is by writing with operating specificity, not motivational vagueness. A founder of a niche B2B tool with 800 right-fit followers is often in a far stronger position than one with 20,000 fellow indie hackers cheering each other on. Engagement rate among the right people tells you more than any total: a thousand followers at a healthy engagement rate beats twenty thousand at a fraction of a percent.
The practical reframe is restraint. You do not need a dashboard of forty numbers. The consistent advice across these sources — from Monolit to the Build a Digital Brain newsletter — is to pick a handful of metrics that map to your current goal and track those, not everything. If your goal right now is pipeline, you track signals that lead to pipeline. If it's audience quality, you track resonance. The rest is noise that makes you feel busy. The next section is the short list worth watching.
The leading-signal scoreboard: the metrics that move before revenue
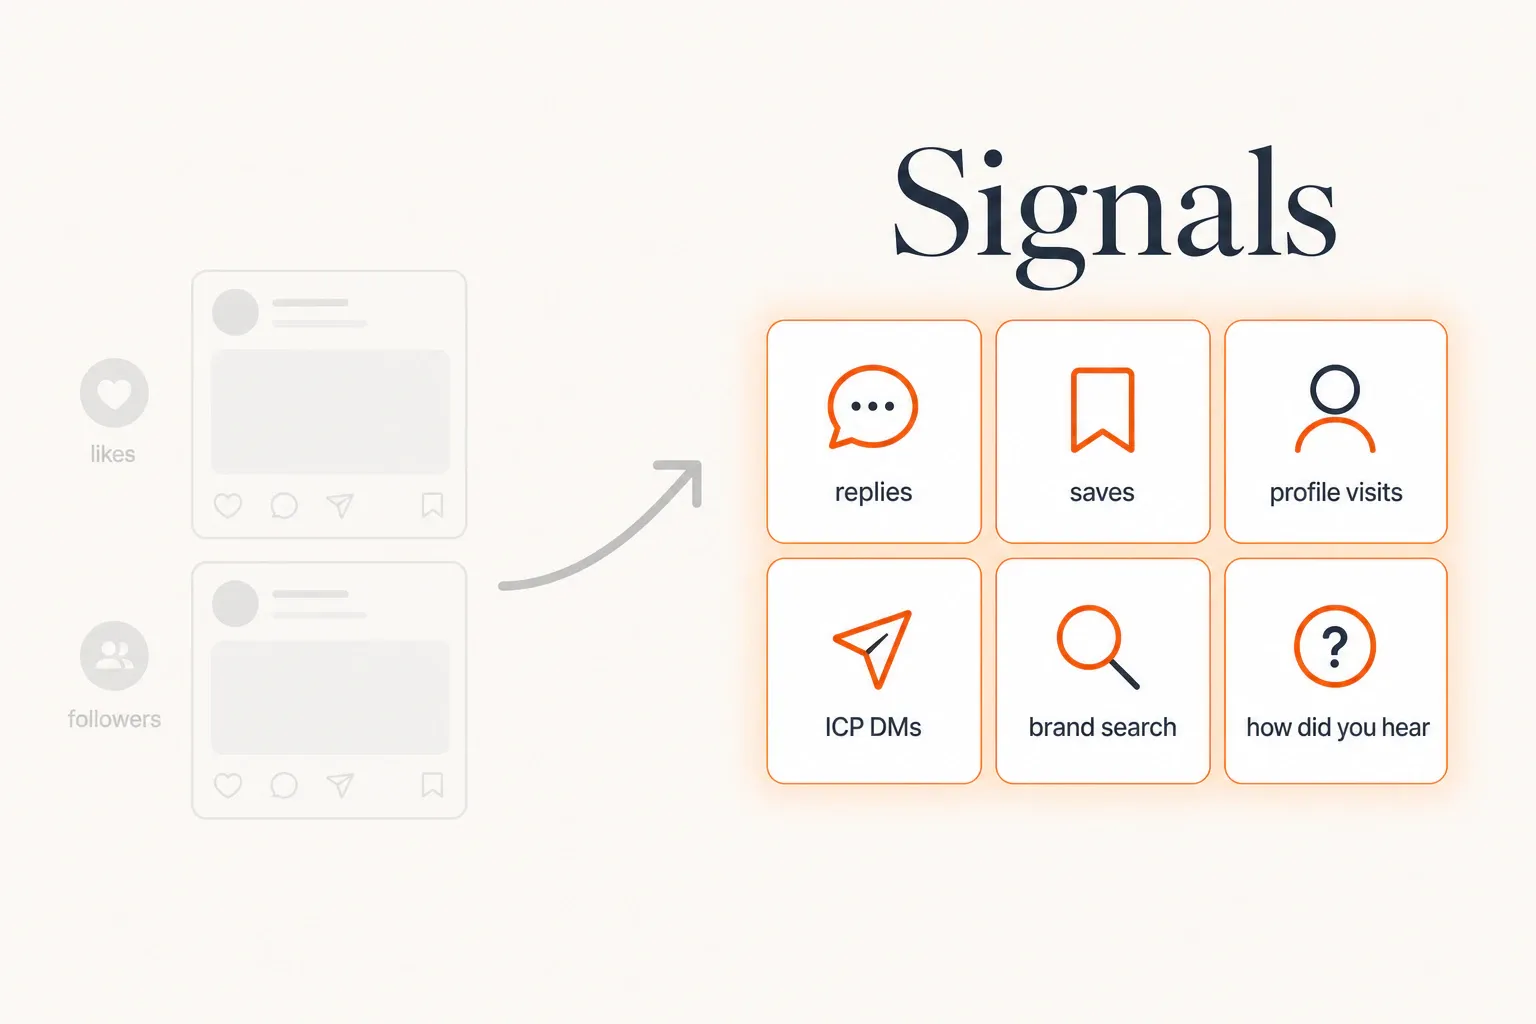
Think of these as five to six instruments on a small dashboard. None of them is revenue. All of them tend to move before revenue does, which is exactly why they're useful: they tell you whether you're on track months before the bank account will. Pick the ones that fit your goal and ignore the rest.
Reply quality and early engagement velocity
The first signal isn't how many reactions a post gets — it's what kind. Ten thoughtful, on-topic replies from people who clearly understand your problem are worth more than a hundred "great post!" comments. As Search Engine Journal's analysis of founder-led growth frames it, likes are vanity but a single substantive comment from someone in your ideal customer profile (ICP) can be worth more than a hundred reactions from fellow founders. Early engagement velocity matters too: a flurry of genuine replies in the first hour is a stronger signal of resonance than the same number trickling in over a week. Read the content of your comments, not just the count.
Saves and bookmarks
Saves are one of the most underrated signals available, because a save means "this is useful enough that I want to come back to it." The Build a Digital Brain newsletter calls out a particularly telling pattern: high saves on low impressions is a hidden gem — it means the right people found your post valuable even though the algorithm didn't push it far. That's a green light to write more of that kind of post, regardless of how the like count looked. A related, quieter signal is the like-to-view (or save-to-view) ratio: it tells you how hard a post resonated relative to how many people actually saw it, which is far more useful than raw totals.
Profile visits per week
When someone reads a post and then clicks through to your profile, they're doing something likes don't capture: signaling curiosity. They want to know who you are and what you're building. Both LinkedIn and X surface some version of profile-view or visit data, and tracking it week over week is a clean read on whether your content is making the right people lean in. Rising profile visits from your target segment is one of the cleanest "it's working" signals you can watch, and it shows up well before anyone fills out a form.
ICP-relevant inbound DMs
Not total DMs — ICP-relevant ones. The leading indicator of pipeline that recurs across 2026 founder-content sources is the unprompted, on-profile message from someone who looks like a buyer: a question about your product, a "how does this handle X," a quiet "we have this exact problem." These are, as Search Engine Journal's founder-led growth analysis puts it, among the warmest leads in your pipeline, because the person already trusts your expertise from consuming your content. Founders who post consistently for a couple of months commonly start receiving these unprompted. A bot-flavored "love your content!" DM is noise; a specific buyer question is signal. Track the buyer-shaped ones.
Brand-search lift and self-reported attribution
These two are the bridge between social activity and revenue, and they're the most honest answer to attribution — which is genuinely hard for organic content. Brand-search lift is simple to watch: are more people searching your name or product over time? Google Trends and Search Console both show this. Work on share of search, popularized by Les Binet and the IPA, found that branded search behaves as a leading indicator of market share, typically leading revenue on roughly a 6–12-month lag. Self-reported attribution is the other half: add a "how did you hear about us?" field at signup or ask it on demo calls. No single tracking pixel will catch the founder who saw a dozen of your posts over three months and then searched your name — but as you keep posting, you should see an obvious, growing share of people saying they found you through your content. The exact number doesn't have to be perfect; the trend is the signal.
Optional add-on: track which post shapes earn the signal
This last one isn't a seventh signal — it's an add-on that tells you where the six signals are coming from. If you have the bandwidth, tag each post by type and watch how the signals behave over time. A pattern several sources note is that decision-and-lesson posts tend to keep accumulating saves, replies, and visits for weeks, while milestone or celebration posts spike for a day or two and then go quiet. Knowing which shape of post earns your leading signals tells you exactly where to spend your next writing hour.
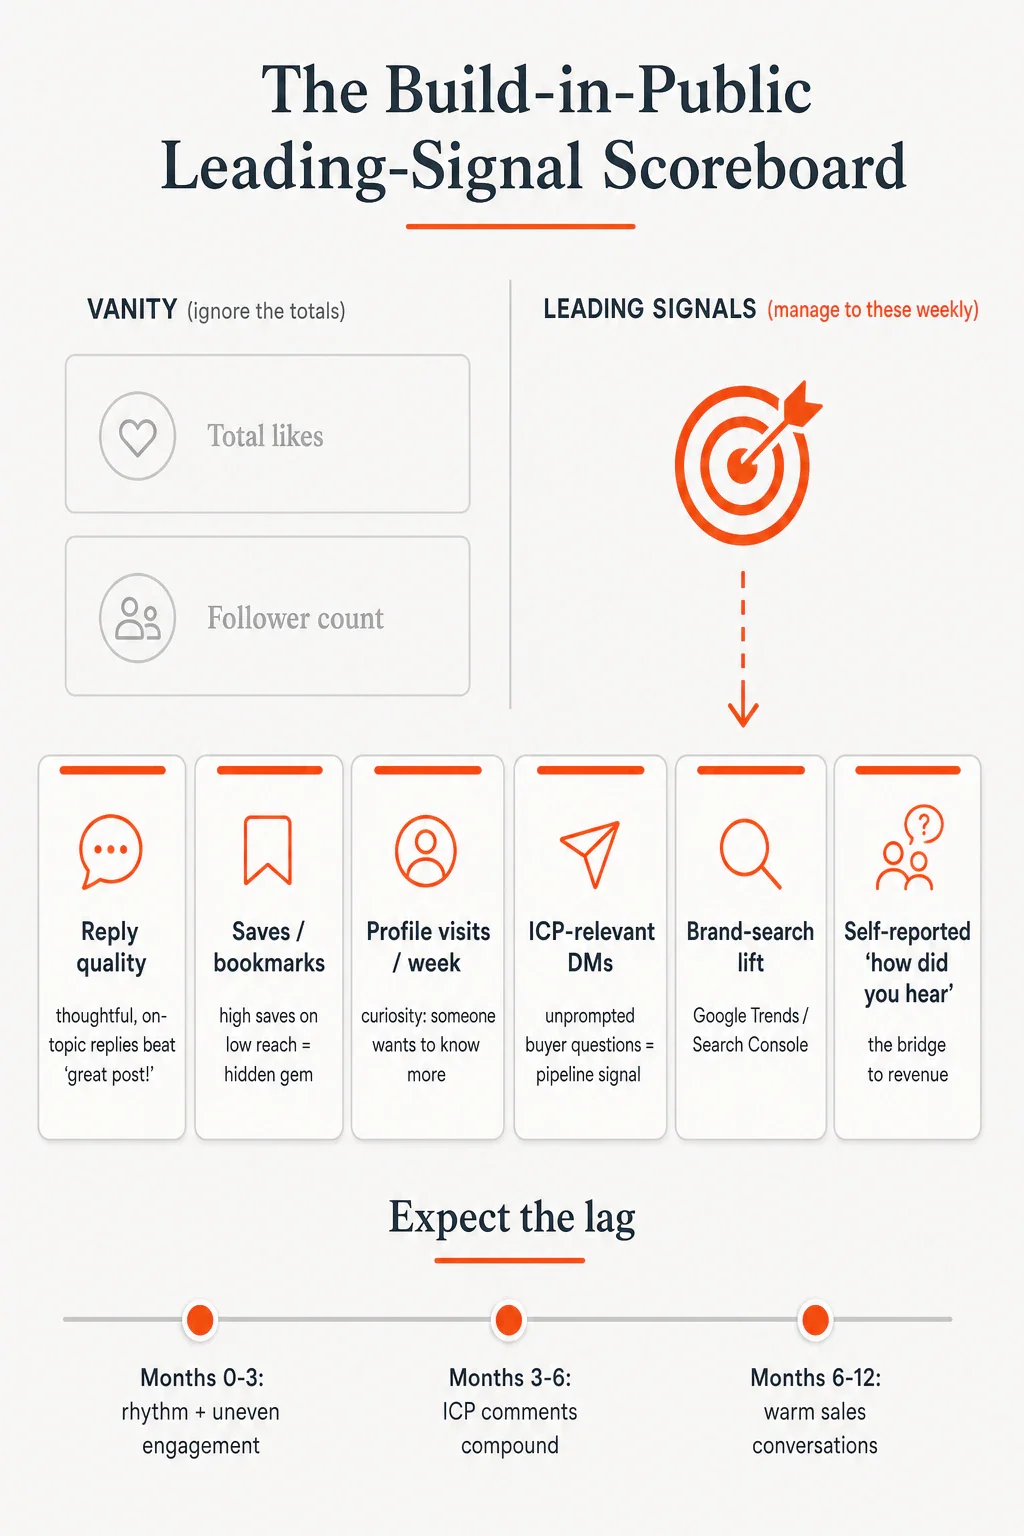
The infographic below summarizes the full scoreboard — what to ignore, the six signals to manage to, and the lag you should expect before any of it touches revenue.
Set realistic expectations: the leading-to-lagging timeline
The single biggest reason founders abandon build in public is impatience with a process that is designed to lag. The consensus across multiple 2026 practitioner sources is consistent: compounding takes roughly three to six months to start feeling real, and pipeline impact typically lands somewhere between month six and month twelve. One founder-content operator's rule of thumb is blunt — give it three to four months, and if you're not seeing some lift in inbound by then, something in the approach is off. The brand-search-to-revenue relationship sits on a similar 6–12-month curve. This isn't a reason to lower your standards; it's a reason to measure the right thing on the right clock.
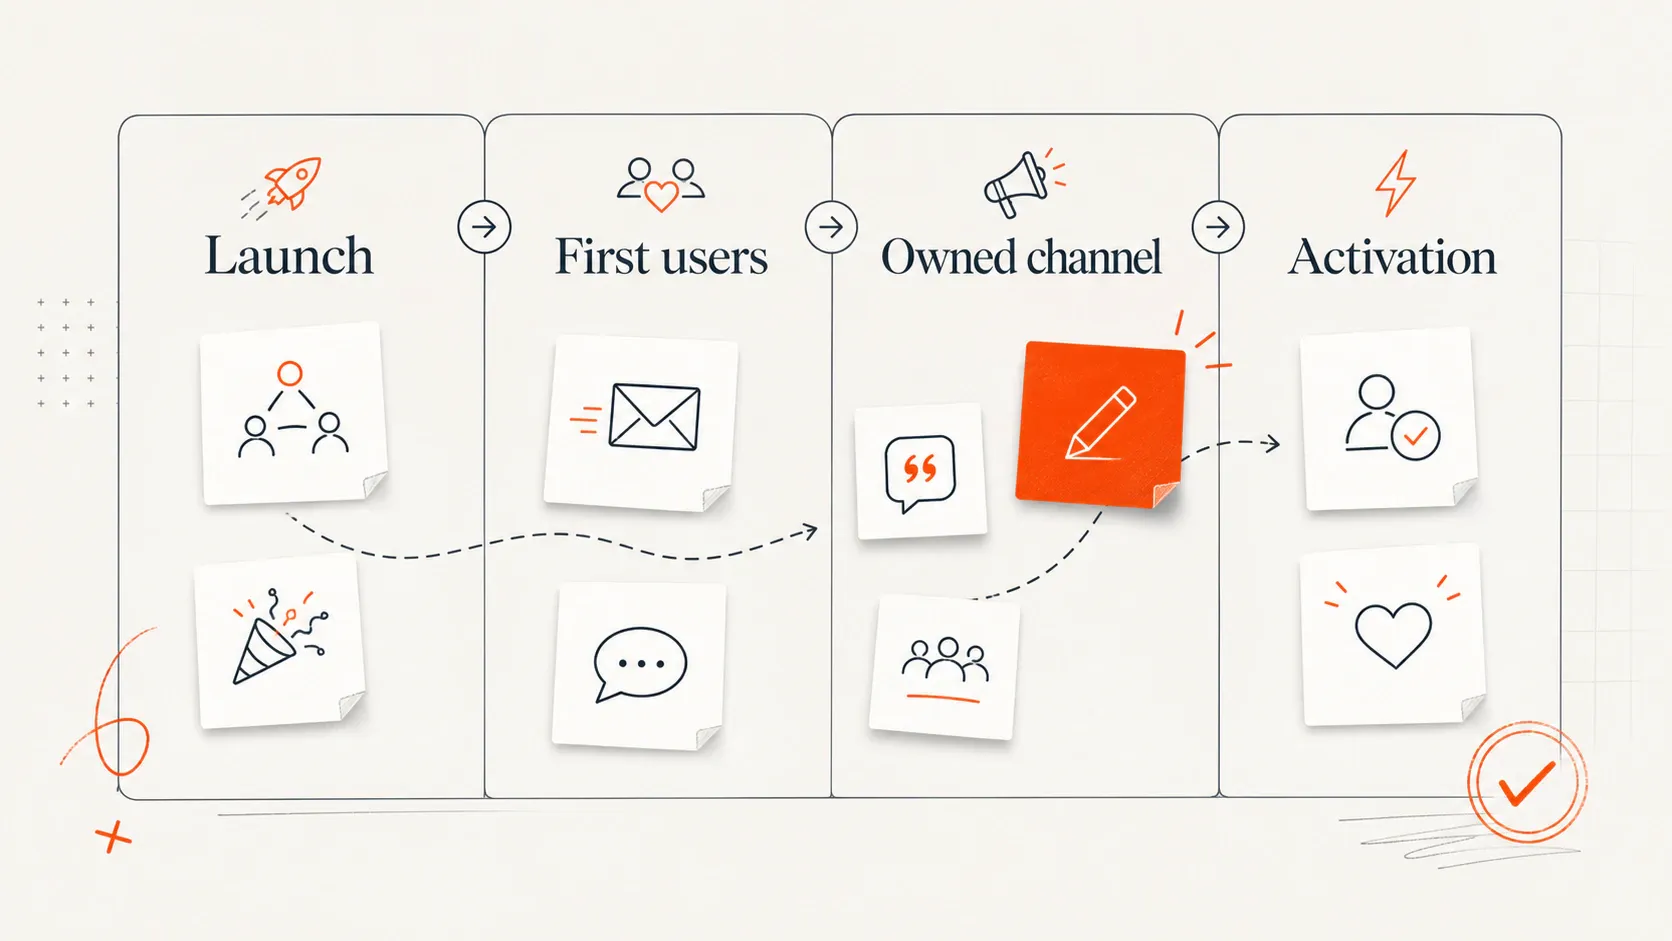
It helps to know roughly what each window should look like. In the first one to three months, expect rhythm and uneven engagement: some posts land, most don't, and that's normal while you and the algorithm both figure out what you're about. By the middle stretch (months three to six), you should start seeing ICP-relevant comments and the occasional buyer-shaped DM — the leading signals from the scoreboard beginning to move. Later (months six to twelve) is when warm sales conversations and self-reported "I've been following you" mentions tend to show up. Manage to the leading signals weekly; judge the lagging outcomes patiently.
So how do you read an account that feels like it's failing? Don't look at the like count — look at the scoreboard. If after roughly six consistent months you're getting zero unprompted ICP DMs and zero signup or call mentions of your content, that's a real signal, but the fix is almost never to quit. It's almost always to sharpen specificity: write with more operating detail, narrow who you're talking to, and trade vague milestone updates for the decisions and lessons behind them. The discipline that holds all of this together is keeping leading signals and lagging outcomes in separate columns of your head: manage to the leading ones every week, and don't panic-judge the lagging ones month to month.
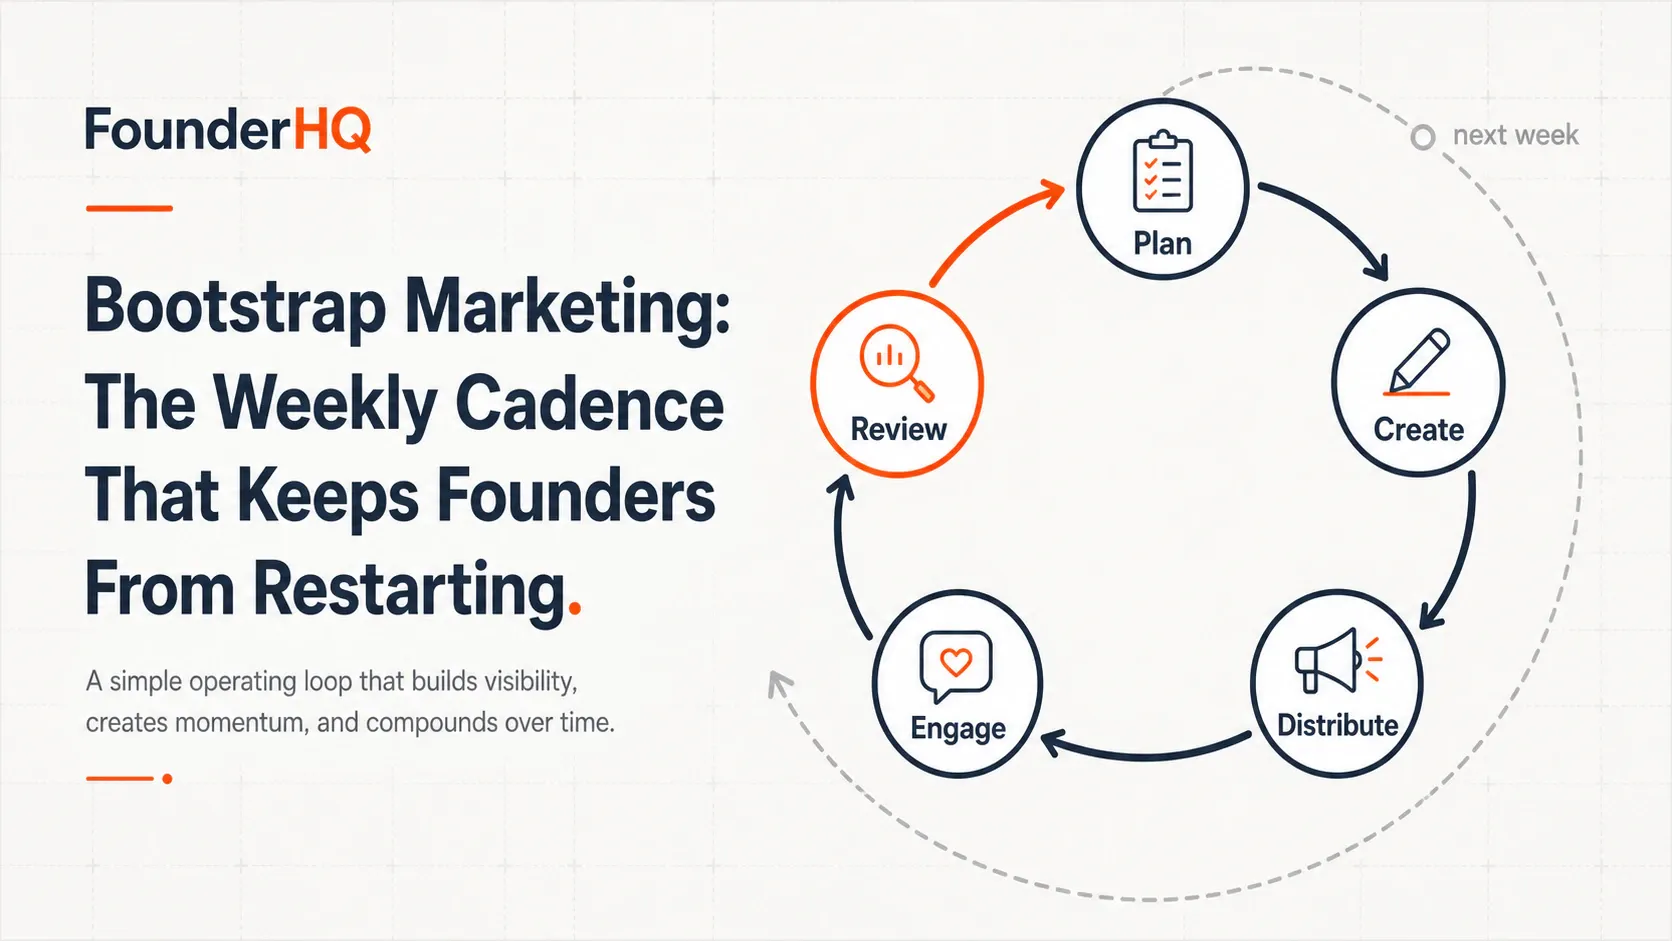
Run it as a weekly loop on a team of one
A scoreboard you check sporadically is just another anxiety source. The version that works is a short, fixed weekly review a solo founder or 2–3 person team can actually hold — fifteen to twenty minutes, same slot each week. Pull the handful of numbers (replies of substance, saves, profile visits, buyer-shaped DMs, any signup mentions), note which post shape earned the most of them, and use that to decide next week's mix. That's the whole loop. Its value isn't the data collection; it's that it forces a small, evidence-based decision every week instead of a vibe-based one.
Tie each signal to a concrete next test so the review ends in action, not just observation:
- Thin reply quality → write more specific, decision-level posts; reply to your own commenters to start real conversations.
- High saves, low reach → you found a hidden gem; make more of that exact post and lead with a stronger hook.
- Profile visits up, DMs flat → your bio, pinned post, and link aren't converting curiosity; fix the profile real estate.
- DMs from the wrong people → your framing is attracting peers, not buyers; tighten who you're writing for.
Two habits make this loop compound instead of reset every week. First, keep a kept/killed log of hooks and post shapes — what resonated, what flopped — so you stop re-guessing what works and start building on proven angles. This is the founder-led-content-as-a-system mindset that 2026 operators keep returning to: treat it as a repeatable process with a memory, not a series of one-off posts. Second, give the scoreboard and that log one persistent home. Scattered screenshots, a half-remembered note, and three different analytics tabs guarantee you'll lose the thread — and lose the connection between a signal and the post and decision that drove it. One place beats memory every time.
Where FounderHQ fits
That "one persistent home" is exactly the gap FounderHQ is built to close. FounderHQ is a focused operating system for early-stage product teams that brings a builder, a writer, and a workspace together — and for build-in-public measurement, the relevant pieces are the workspace and the writer. The workspace (company context/memory) is a natural place to keep both the scoreboard and the decision record behind each post, so a signal and the work that earned it live next to each other instead of scattered across screenshots and memory. When a post earns a wave of saves, the decision it described is right there — not lost in your feed.
The writer (founder-led content) closes the other half of the loop: posts drafted against that persistent context tend to stay specific and consistent, which — as every source in this article agrees — is the upstream lever that makes the leading signals move in the first place. The kept/killed log of hooks that worked, and the real decisions behind your shipping, become raw material for the next post instead of something you re-derive from scratch each week.
Two honest caveats, in keeping with how FounderHQ talks about itself. First, we're not claiming specific outcomes — no customer counts, conversion lifts, or time-saved figures, because the point of this article is that those numbers lag and are hard to attribute. Second, the framing is deliberately augmenting the founder, not running anything for you: a system that helps you measure leading signals and compound what works, not one that promises to operate your company while you sleep. The leverage in build in public isn't chasing a bigger like count. It's knowing, week by week, which small signals are moving — and quietly compounding the work that moves them.
Conclusion
Building in public works, but not on the timeline or the dashboard most founders are watching. Likes and followers will grow whether or not anything real is happening; the signals that tell the truth — reply quality, saves, profile visits, ICP-relevant DMs, brand-search lift, and self-reported attribution at signup — move quietly, weeks or months before pipeline does. So give yourself the right scoreboard and the right clock: pick three to six leading signals tied to your current goal, review them in a short weekly loop, map each one to a concrete next test, and judge the lagging outcomes patiently across a six-to-twelve-month window. Keep the scoreboard and the decisions behind each post in one persistent place, and you stop re-guessing what works. That's the difference between posting into the void and knowing, with evidence, that the work is compounding.